You finally launched your shiny new analytics platform—Ultimate Web Analytics ProTM. This is going to be great. And it better be—because this analytics platform is expensive—and you sold it through to stakeholders across your org. The expectations are high.
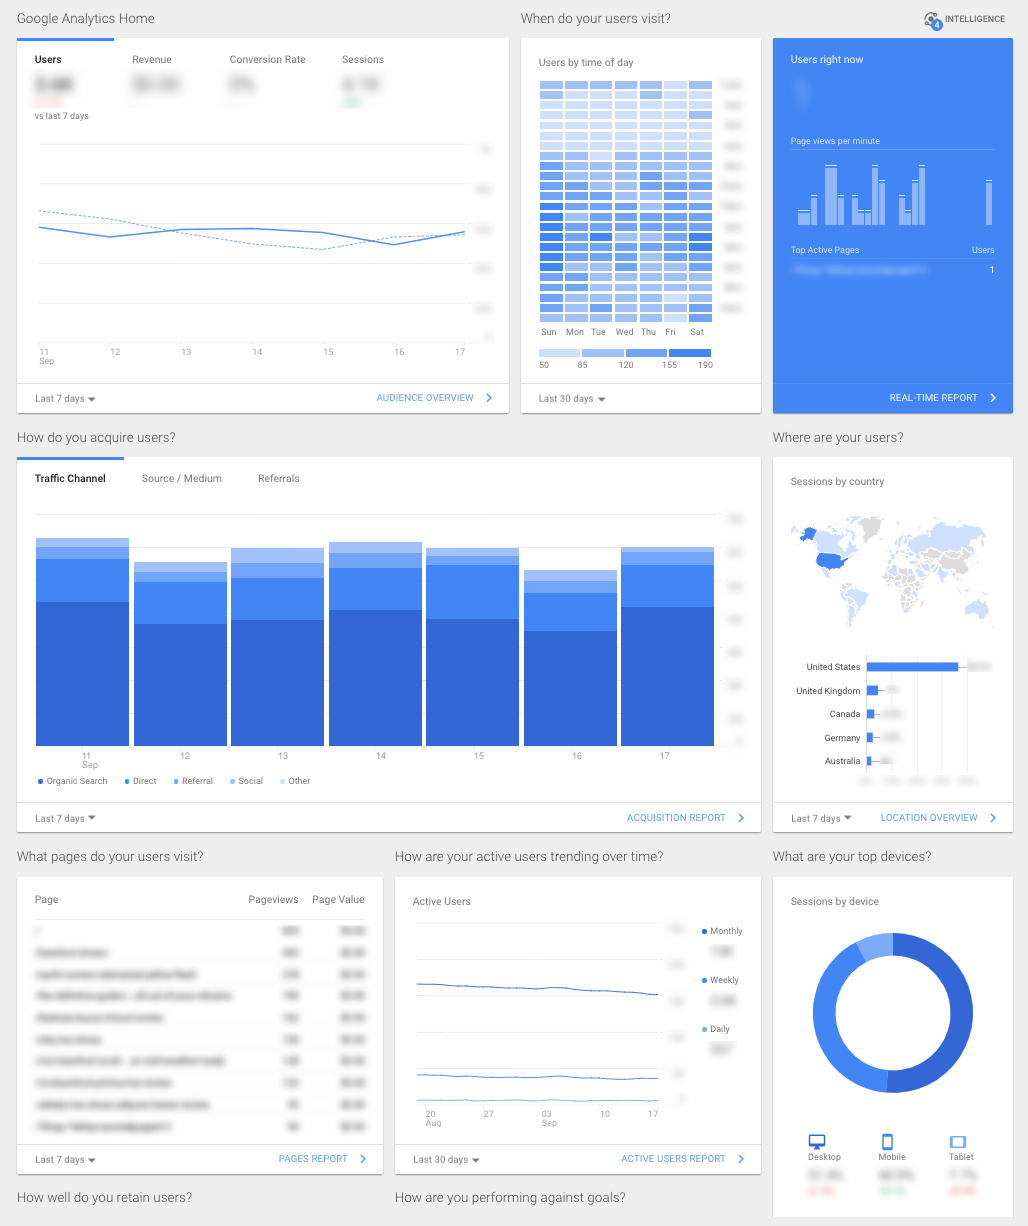
As you fire up the tool for the first time you're greeted with a dynamic dashboard filled with beautiful bar graphs, provocative trend lines, tasty pie charts, and loads of user metrics—all the things you'd expect from a cutting-edge digital analytics service. It's a little overwhelming but you're optimistic. Perhaps—finally—you have the digital intelligence you need to help your organization make better decisions.
Only, as the weeks go by with countless hours spent mining and monitoring metrics, you're left with a nagging suspicion something is wrong.
But what is it?
What Does Security Have to Do With Signaling?
A little over ten years ago, security expert Bruce Schneier wrote Beyond Fear and coined the phrase "security theater."[1] Security theater is when an organization engages in behaviors that signal security even if those activities don't provide any additional, real security, at all.
The most commonly cited examples of security theater in recent years tend to involve the TSA—that is, airport security—but if you've ever noticed the blinking red light in your locked car you've witnessed a bit of security theater.
Security theater is a form of signaling. What's signaling? Signaling is when information is communicated indirectly through a medium separate from the underlying reality. E.g. gestures, actions, products, behaviors, etc.
Signaling is everywhere—from banks being made of marble, signaling wealth and stability, to little puffer fish creating "art" on the ocean floor to signal fitness to potential mates.[2]
You might think of signaling as advertising—trying to convey information about something more complex. When signaling works, the signals act as a useful proxy—a kind of hueristic. When signals don't work, they take on a life of their own. They can become a confusing distraction or worse, lead to making poorly informed decisions.
Security theater is an example of wasteful signaling—sending a costly message of safety that doesn't hold up under scrutiny.
So what does this have to do with web analytics?
How Charts and Graphs Put On a Show
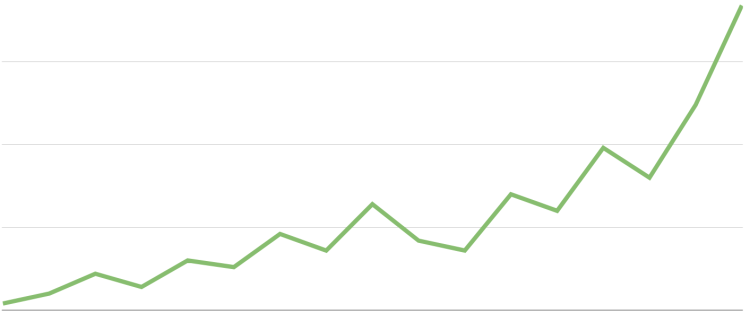
The purpose of analysis is to distill complex underlying realities into salient insights—the kind that inform decisions. Just like signals. The signals in analyses come in the form of visualizations (charts, graphs, etc.) and metrics. Consider this trend line:
Without knowing anything about the data behind the chart, what's the signal? You might guess that this graph represents an underlying reality that is good. If you saw this kind of graph in the context of a presentation—accompanied by a narrative you have no reason to question—you'd likely begin to nod your head in understanding. This is good. After all, up and to the right means warm fuzzies.
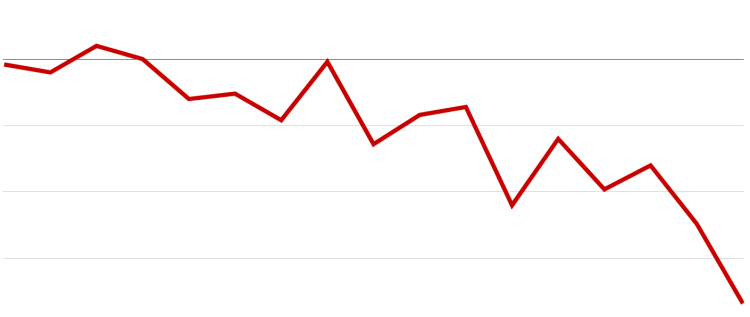
Now look at this next trend line. It presents a very different, yet equally clear visual story:
Ouch. That doesn't look good ... someone has some explaining to do!
What's going on here? As discerning as we may be, when you run into enough analytics, you inevitably become trained to draw conclusions. You process visualizations instantly without a critical thought.
Here we see signaling at work. Remember: the power of signals is that they can tell us something without us having to think critically.
This lack of critical thinking can create problems because decisions made based on signals have real consequences. Instead of mindless nodding, we might be better served taking a second look. The next time you see some warm fuzzy-generating chart—or wince-inducing graph, let that be a different kind of signal—one to start asking critical questions:
Does the graph accurately represent the underlying reality?
Is the "insight" you're getting telling you something useful?
Am I better able to do my job because of this analysis?
If "No" is the answer to any of the above questions, your analytics signals may have gone off the rails—you may be experiencing analytics theater.
The fact is the savior, as long as you don’t jam it into some preconceived pattern. The greatest obstacle to discovery is not ignorance—it is the illusion of knowledge.
—Daniel Boorstein
Now Introducing Analytics Theater
What is "analytics theater?" It's when your web analytics serve up metrics, charts, graphs, and more that give the appearance of valuable insights—while being near useless and/or poorly reflecting what's actually happening.
Analytics theater is a show of signals that seem like insights—but are more like noise.
You've certainly experienced analytics theater. Very likely, you may have even put on a show, yourself. These days, it's too easy to razzle dazzle with data. (Finding true insights is hard.)
That said, there are a few places you're more likely to run into analytics theater. Here are a few common offenders:
Automatically generated dashboards
Monthly reports (particularly if they trot out the same metrics)
Ad-hoc analyses that backfit data to justify decisions
Powerpoint presentations with slides and slides of graphs and numbers

And you're right: None of the above instances need necessarily be analytics theater. There are plenty of useful reports and dashboards.
However, next time you see that whizbang dashboard with all its metrics and graphic visualizations, ask questions. Are the analytics signaling something insightful or simply summarizing performance? Having read through the "insights" in your report, do you feel compelled to take specific action?
If your analytics leave you with little more than good feeling, perhaps there are better ways to spend your time.
The Most Insightful Analytics Drive Actions
If you want to know if the signals you get from your analytics are more than theater, direct your attention to outcomes:
Do your analytics help you determine what you should do next?
Do they empower you to dig deeper for additional information?
Do your most important metrics tell you enough to make a decision?
The best analytics produce insights that help you decide and drive you to take action.
They motivate you.
Isn't it Time You Expected More From Your Web Analytics?
A little bit of analytics theater is harmless and unavoidable. Who doesn't like the occasional warm fuzzy—like seeing DAUs (or revenue!) go up and to the right? And sure, sometimes a "status update" is all you need.
Just don't confuse those signals for the kind of insights on which you can take action. Remember, you've spent a lot of time and energy on your analytics platform. Make sure the investment is worth it.
If you really want to put your analytics to work, demand that your analyses spit out more than pretty charts and graphs: make sure it provides you with analyses and insights you can use.
Otherwise, what's the point?
Updated April 3, 2019. Originally published September 18, 2017.
See Google books search inside Schneier's Beyond Fear here (2006). An old discussion on examples of security theater at slashdot here. ↩︎
See also the biological concept "signaling theory." ↩︎


