Can you survey your users without disrupting the customer experience?
If you run any type of online business, figuring out the sources of your most profitable customers can elicit major headaches. Even for the most digital-savvy e-commerce firms, marketers have to resort to complicated and expensive ways to collect otherwise uncollectable data.
What makes attribution so hard? Leads don’t always originate from a single source or even from a source you can clearly identify. For example, many leads originate offline, either via word-of-mouth or conferences, so how do you properly attribute credit to these sources when the only trackable last-click came from a Google search ad?
Moreover, how do you ensure that measuring attribution and the worth of each acquisition channel does not succumb to the observer effect (or the Hawthorne effect)? Your questionnaire is no good if it causes many of your customers to turn their back on your business.
As hard as proper revenue attribution can be, it can make the difference between your marketing team being seen as a cost-center or bread-winner.
Launching a survey
The good news is that your marketing organization can take relatively simple and inexpensive steps to dramatically increase lead visibility. At Fullstory, we've known that our session replay tool fell within a class of products in which word-of-mouth is a critical source of attribution leads. But as the company has grown, our assumed knowledge became insufficient. We needed to precisely measure offline conversions. Moreover, we worried a lack of data could lead to missed opportunities or waste valuable marketing resources.
We considered a few options to measure attribution, such as having our sales team ask their leads about how they heard about Fullstory, or sending survey emails to all of our customers. But these tactics could only reach a small subset of our entire customer base. We were also concerned about a potentially low response rate or, worse, annoying users. Survey responses notoriously have their flaws—it’s always better to observe what users do rather than what then record what they say. However, despite potential noise, we knew that the survey would give us some hint about our current acquisition channels.
After careful consideration, we decided to test out a survey on our marketing site. We took steps to only present the survey at a moment when it was least likely to disrupt the customer experience (while still being timely).

Survey setup
Here's how we did it.
We launched an experiment by using Optimizely to redirect half of our customers to an optional customer survey right after signing up (and before activating their account). We used Jotform to create 12 response choices (a user can select as many as they like) and a text form for respondents to provide additional information.
The rationale for the placement was that we wanted the survey to show up early enough to be close to the point of conversion (“signing up” in our case) but not disrupt the onboarding experience after account activation.
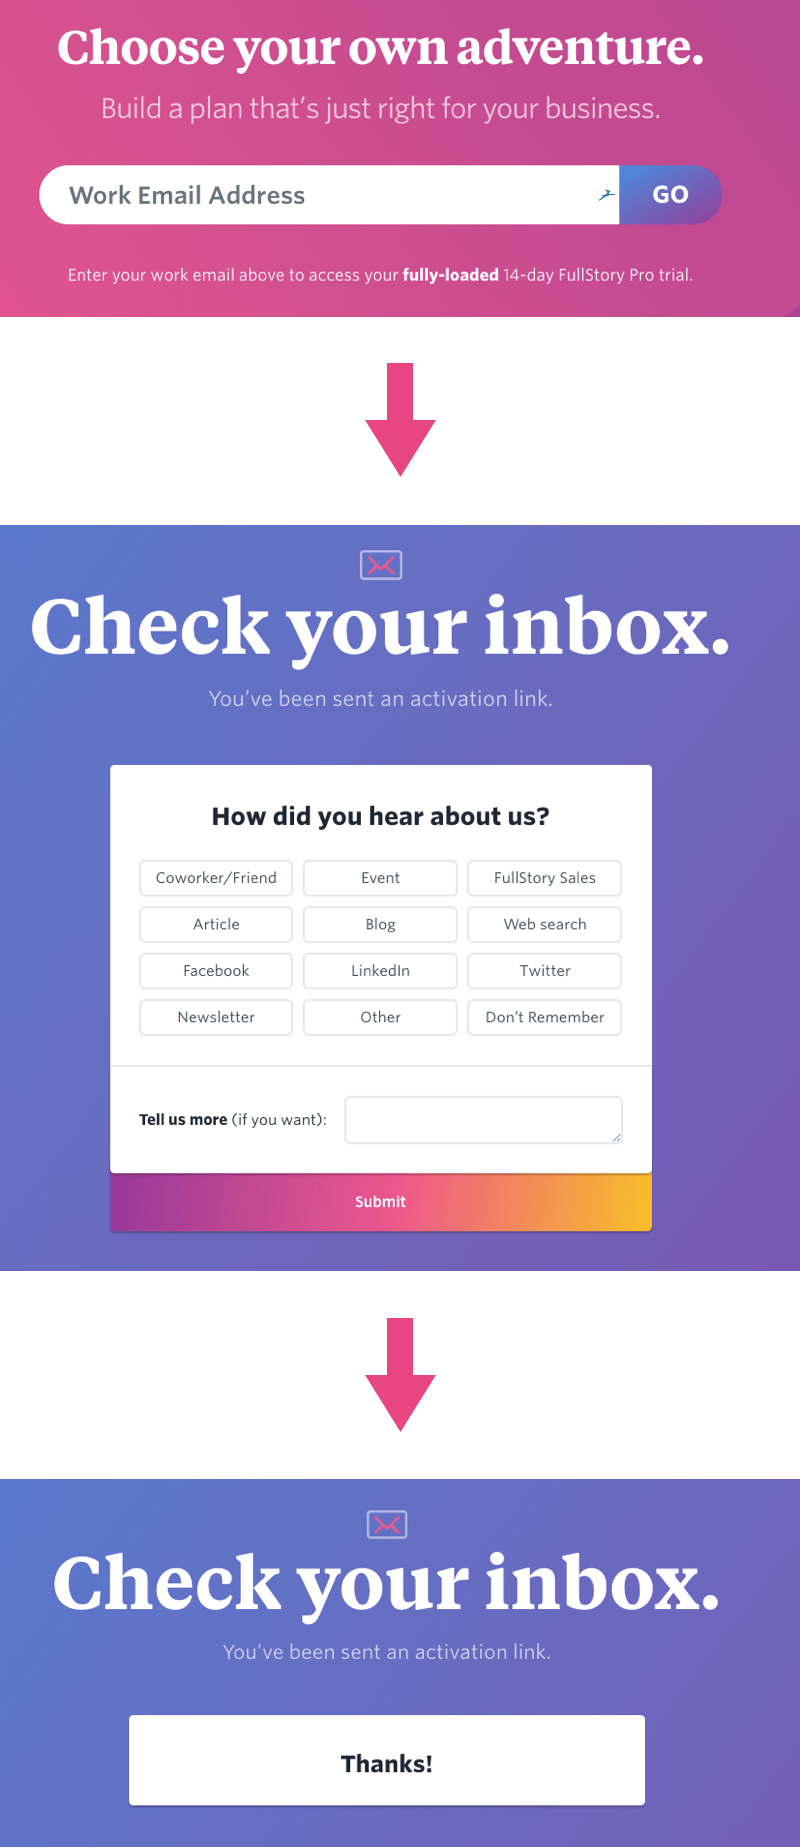
Here's what the user flow looks like:
Sign up: The user enters their email and hits the “go” button.
Survey page: The user is prompted by a call-to-action to check their email for an activation link, but also has the opportunity to fill out the survey if they would like.
Thank you page: If the user decides to fill out and submit the survey, we thank them for taking the time to do so.
Pleasantly surprised by results
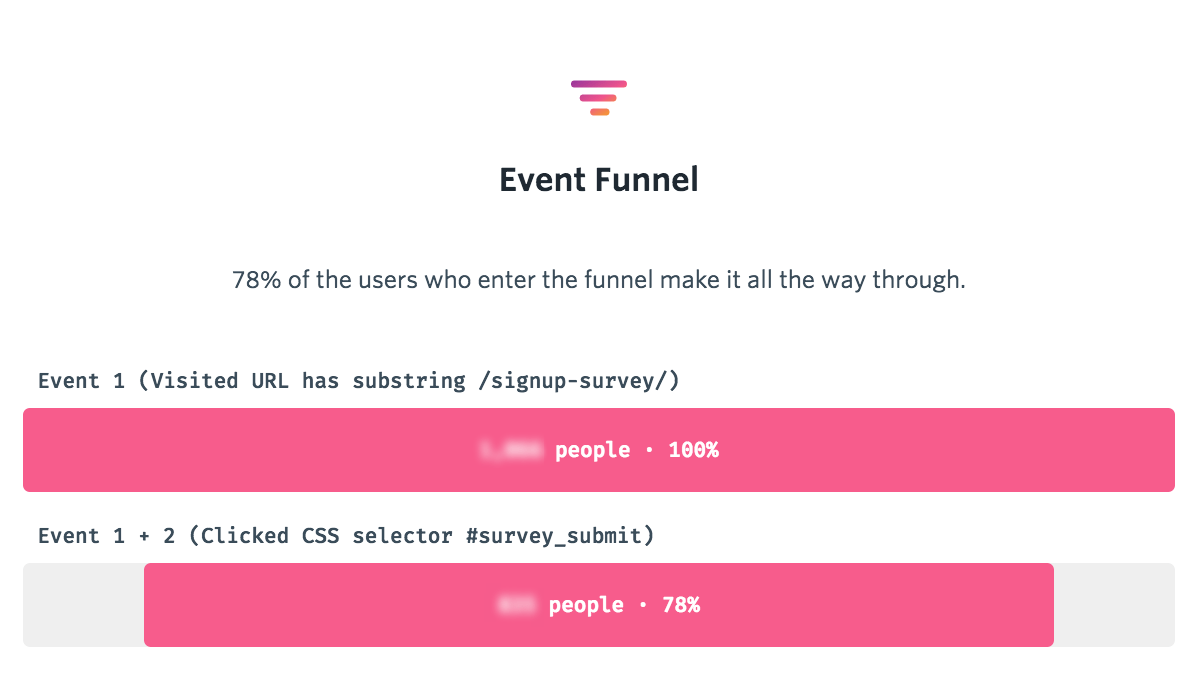
The results far exceeded our expectations, with over 3 out of 4 signups who got the survey submitting a response. This caused us a little anxiety at first, as we considered the result too good to be true for an optional poll. However, we created a Fullstory segment for these users, watched several of their sessions, and realized they interacted with the form as we'd hoped.

The survey helped us understand several things about our customer base:
Our intuitions about word-of-mouth were correct. The largest percentage of respondents indicated that they learned about Fullstory through a colleague or friend.
The open-response helped us discover several digital channels we hadn’t attributed leads to, including Ran Segall’s YouTube channel and Neil Patel’s Marketing School Podcast (Episode 588).
Other interesting lead discoveries included previous employers, industry events, and even developers exploring a website’s JavaScript console.
Do no harm?
Despite revealing useful insights, did the survey detract from our users’ experience or prevent our sign-ups from activating their trial accounts? Here, we turned to Fullstory, searched for sessions in which the survey was answered, and observed real user behavior:

Although users generally navigated our survey seamlessly, we found some potential friction points we feared could potentially sidetrack some users.
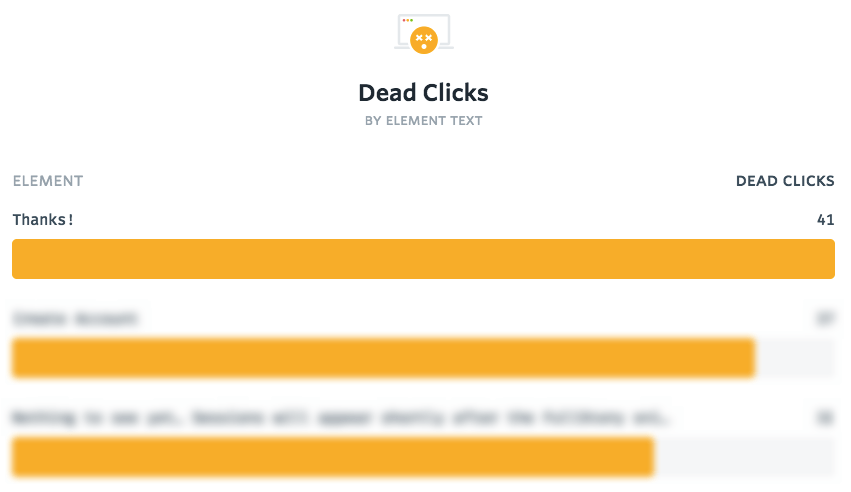
For example, we noticed that users seemed to click on the “Thanks” element (shown above), even though it was not a button.
Our Top Dead Clicks for the survey respondent segment in Fullstory confirmed our suspicions: The “Thanks” element was misleading.
Luckily, the conversion rate differential between our test (those who saw the survey) and control (those who did not see the survey) groups was not statistically significant, leading us to conclude (for now) that the survey did not have a meaningful impact on our conversion rates.
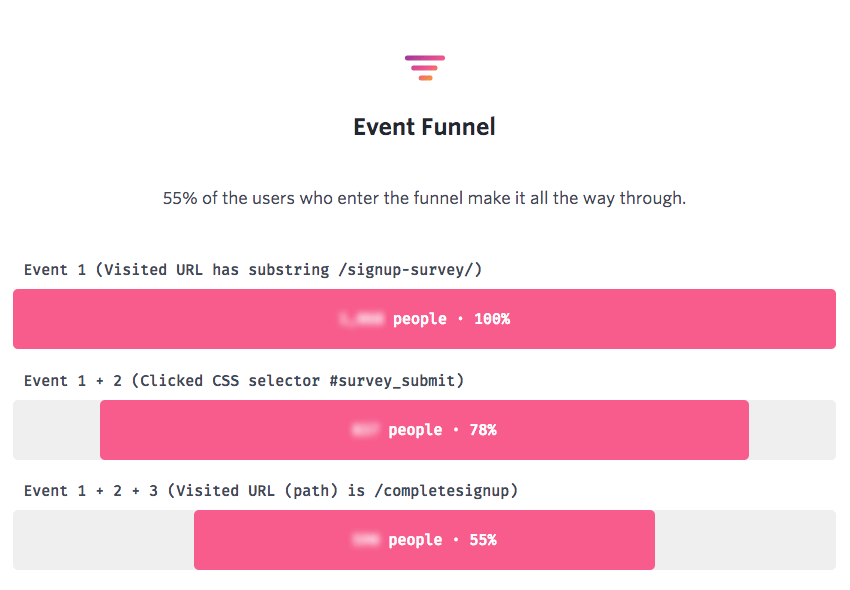
Keep in mind, Fullstory lets us track and search for for almost all UX metrics via OmniSearch and funnels. We further checked in Fullstory to see if users exposed to the survey had a lower rate of recording and playing sessions, and again to our relief, they did not.

Applying to business metrics using Fullstory Data Export
Ideally, we wanted to incorporate the survey results into our broader business metrics in order to:
Optimize our marketing resources to the right channels where people are most receptive to our product
Generate new ideas and test new channels as our company scales
Use the survey data to calibrate quantitative models
At Fullstory, we are heavy users of Data Export. We use it to pipe indexed user event data from Fullstory.com into Google BigQuery. From there, we query the data and match survey results with the costs and revenue we earn for each channel. In fact, using BigQuery, we’ve built a pretty handy dashboard that can tell us the ARR (annual recurring revenue) and CAC (customer acquisition cost) for our main digital acquisition channels, coalesced with some of the categories selected on the survey. Among other useful insights, we identified conferences we've sponsored that led us to big accounts—so we’ll be sure to sponsor and attend them again next year.
Our efforts here were just a start. We'll continue using Fullstory to figure out which product features offer the most value to certain audience segments. This will help us refine our message and present only the most salient use-cases to potential customers.